The factro Gantt Chart is available in the Business and Professional Cloud and offers an appealing project visualization that you can use for your project planning and realization. It is an ideal visualization to keep an eye on your projects' timetable, which is always updated live. Set milestones for important events and decisions, and define dependencies between tasks in the form of predecessor-successor relationships.
 The factro Gantt Chart
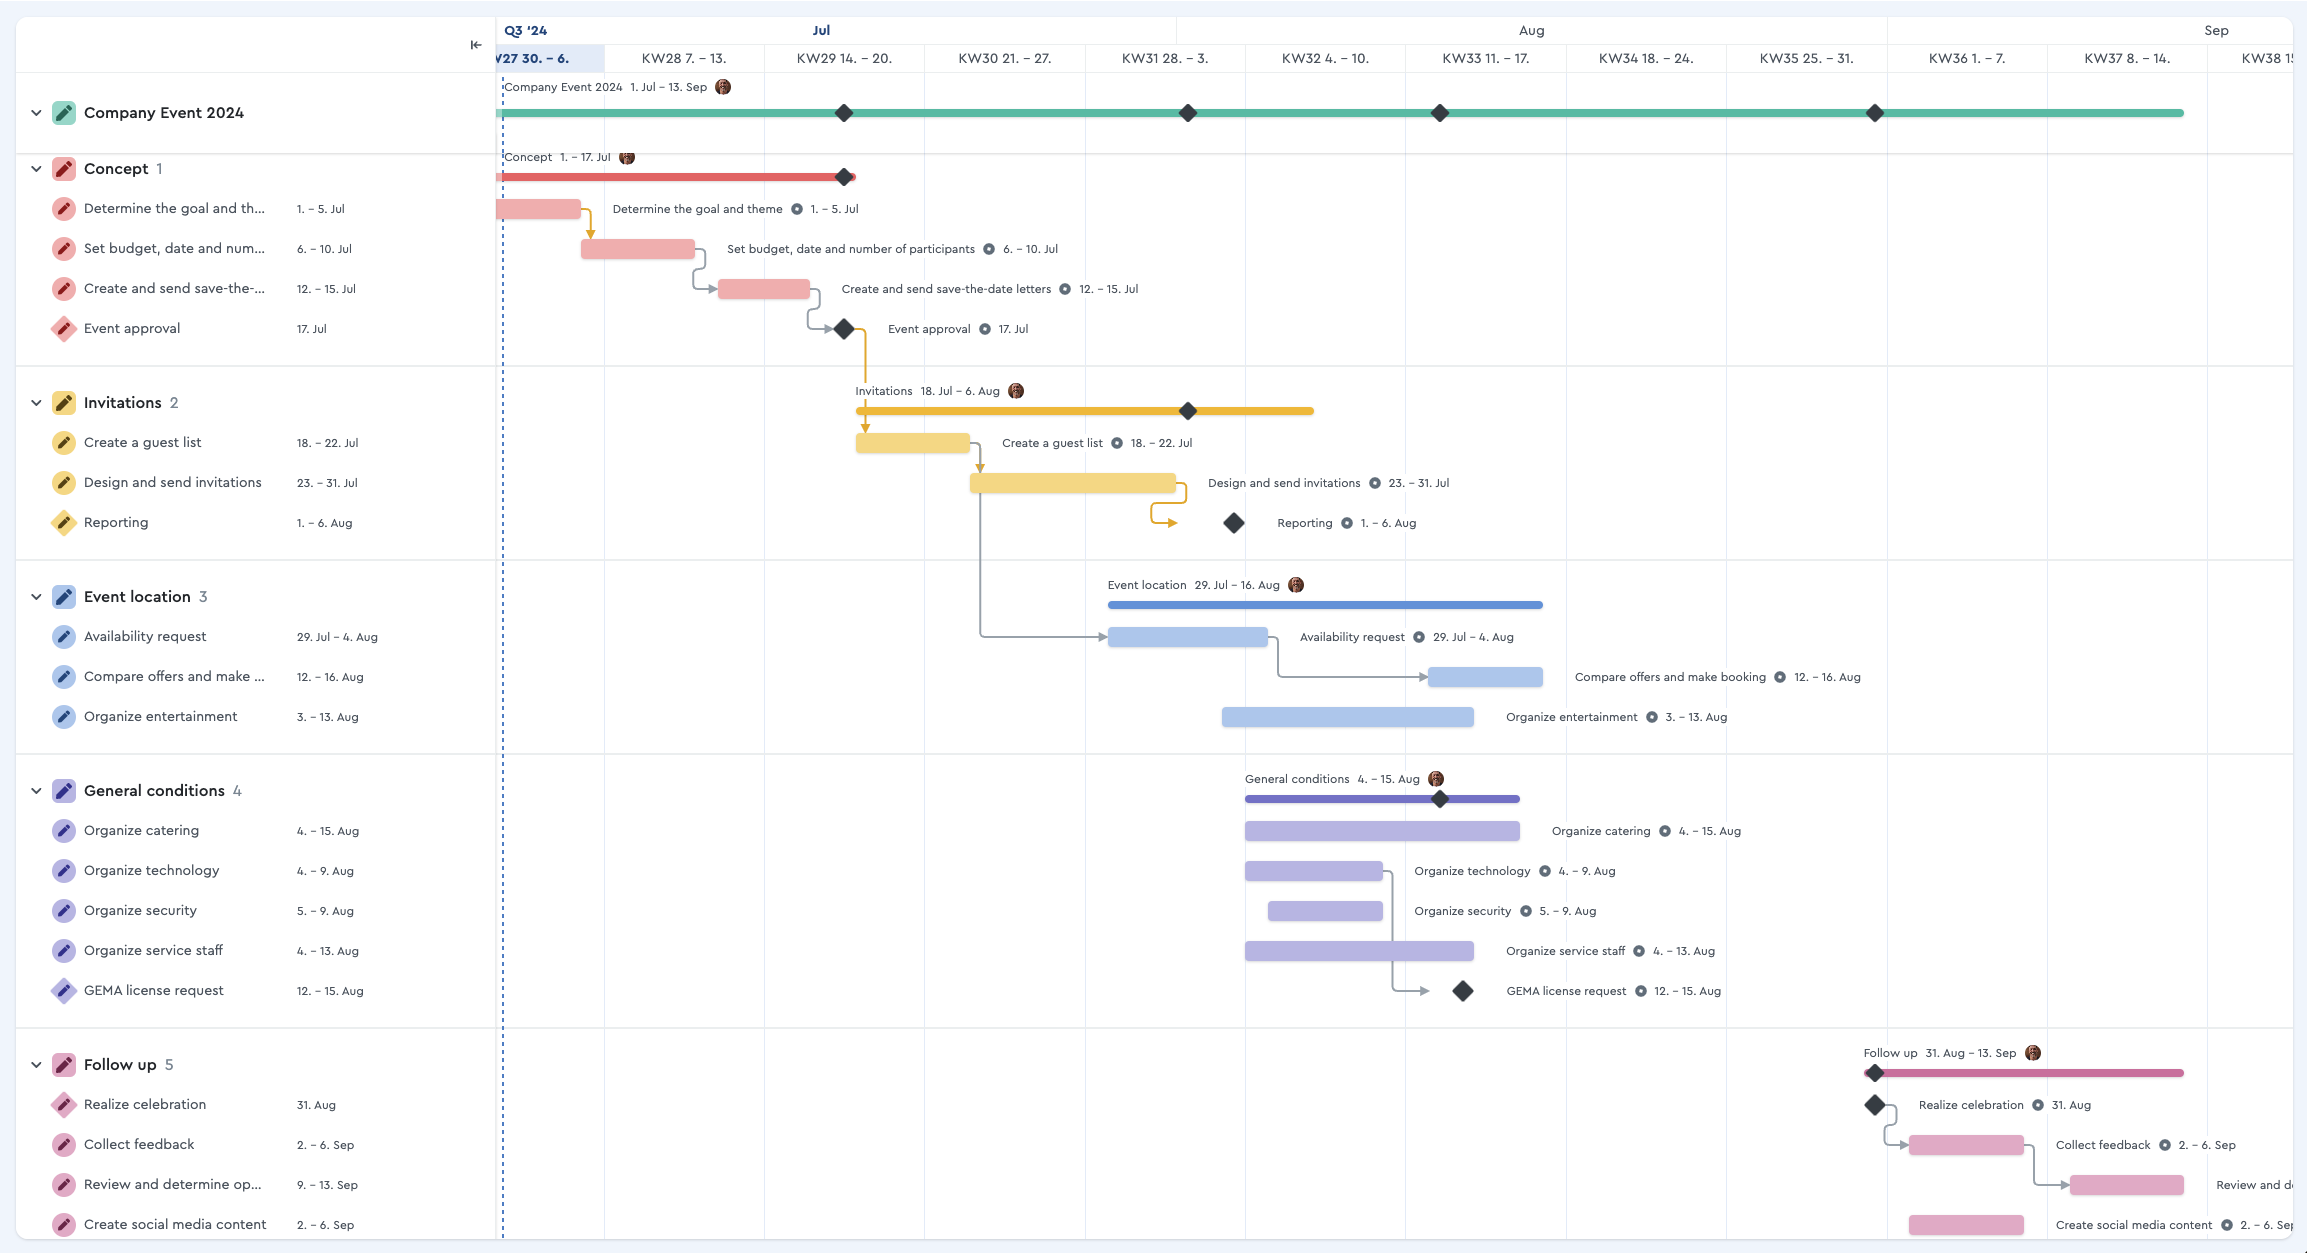
Structure of the Gantt Chart
The project bar appears across all tasks and packages. The narrow bar represents the actual time period, which is framed by a broad bar representing the planned time period.
You can set the time period you want to analyze in the upper area to the left of the filter. You have the option to choose between year, quarter, month, and week in the drop-down menu. To display the rest of the project progress from today, click on the 'Today' button. Clicking on the window next to it will adjust the screen to give you an optimal overview. This can also include past weeks, for example.
To create a Gantt chart, follow these steps
- To start, create a new project with its Work Breakdown Structure.
- Switch the project view from “Structure” to “Gantt”.
- Define dependencies between tasks in the Gantt chart, and mark very important tasks as milestones. Your Gantt is ready!
- Now, you can organize your project. In default settings, the individual tasks are colored in the respective element colors (e.g. the package color). Packages are also displayed in their element color, but with a slightly bolder color than tasks. You can move tasks forward or backward in time via drag & drop, and the package bar will adjust automatically.
- Critical Chain: The project timeframe is the start time of the task that begins earliest and the end time of the task that ends latest. The chronological and logical sequence of all tasks creates the so-called "critical chain". However, in factro it is not separately visualized.
💡 Tip: Define processes once and save them as a template: factro remembers dependencies and time intervals. This way, you only have to select one start date for new projects, and the entire project is automatically scheduled.