factro offers you many possibilities to track your project progress:
Project Overview
In the project overview you can see every project you are involved in. Within each project tile, you find the pie chart. It shows you the total number of tasks in a project, as well as the tasks that have been "done" and also informs you about how many tasks are still in progress.
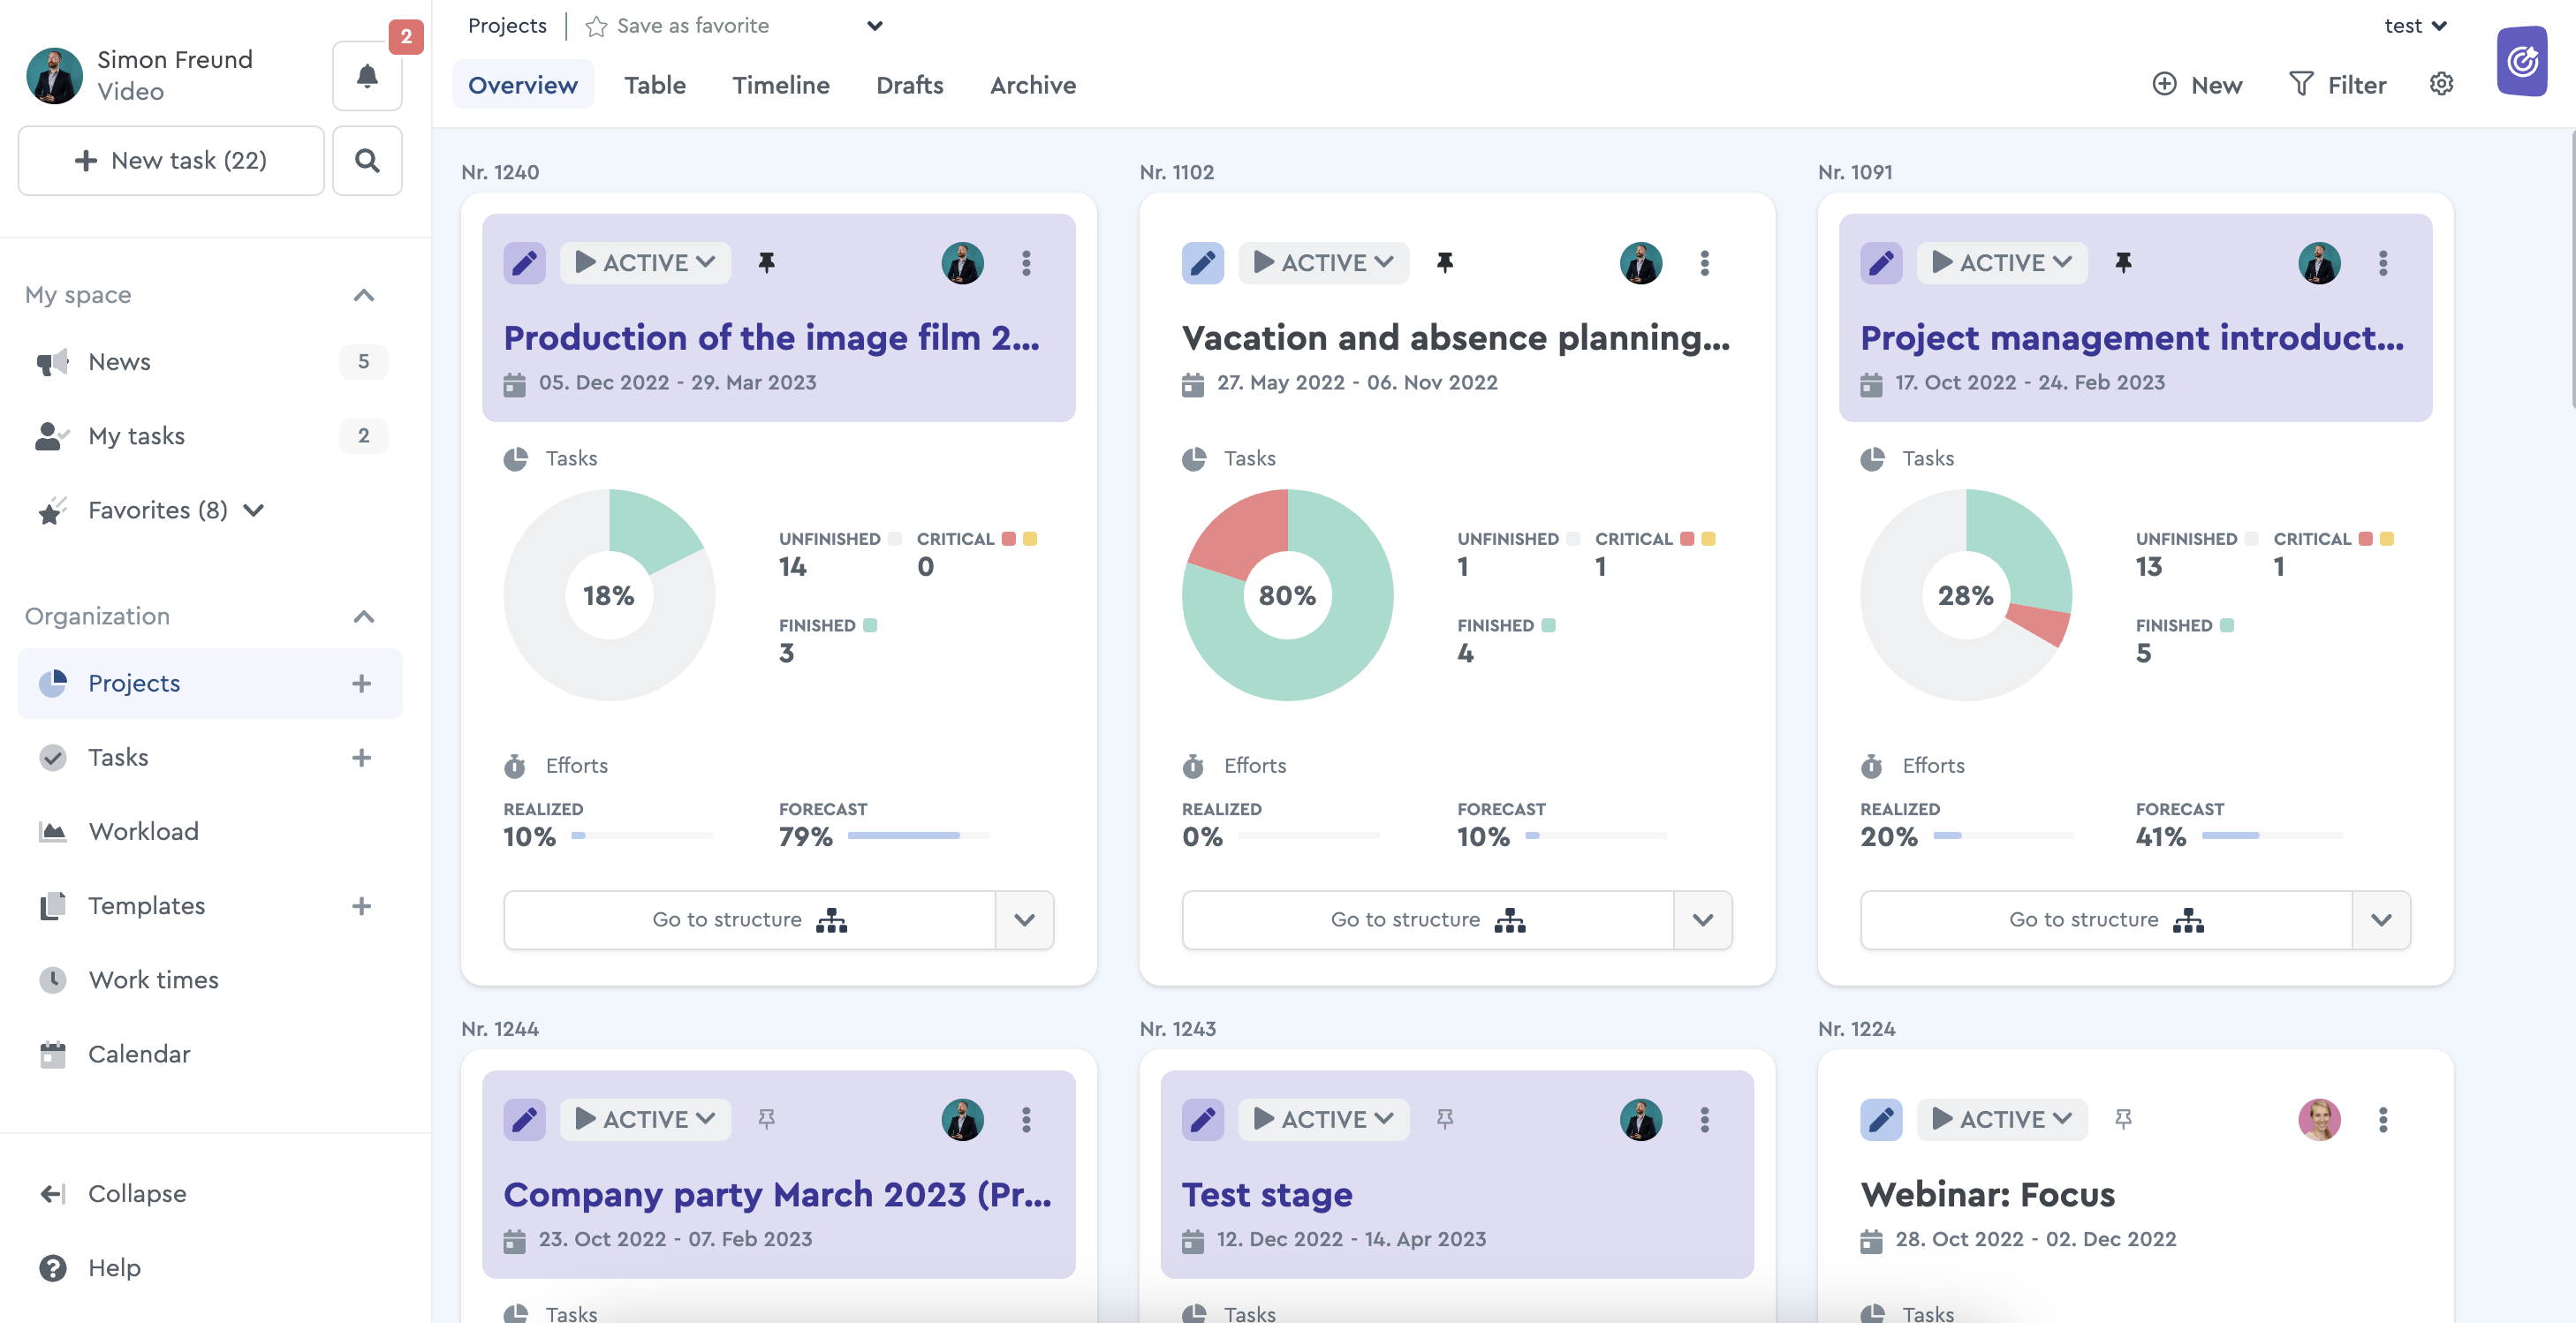 The factro Project Overview
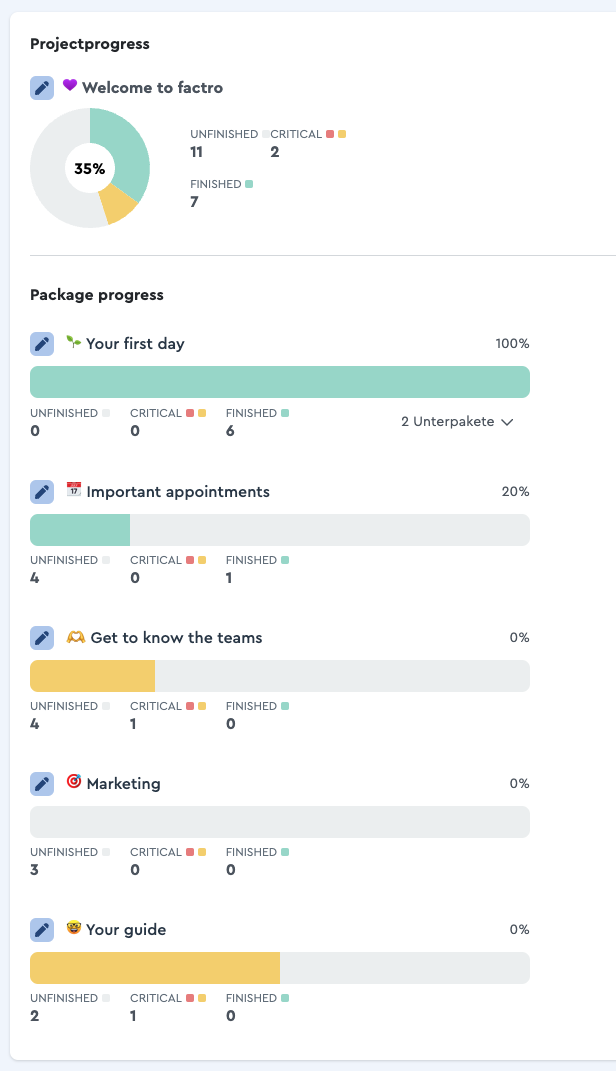
Package progress
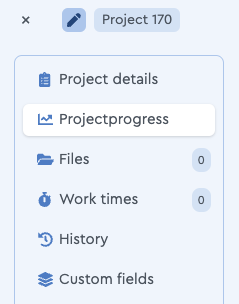
In addition to project progress, you can now also track package progress with factro. If you want to do this, click on the project or package header and then on "Project progress" in the right-hand menu bar if you are in the project header or "Package progress" if you are in the package header.
In this overview, the packages and their sub-packages are displayed on a progress bar.
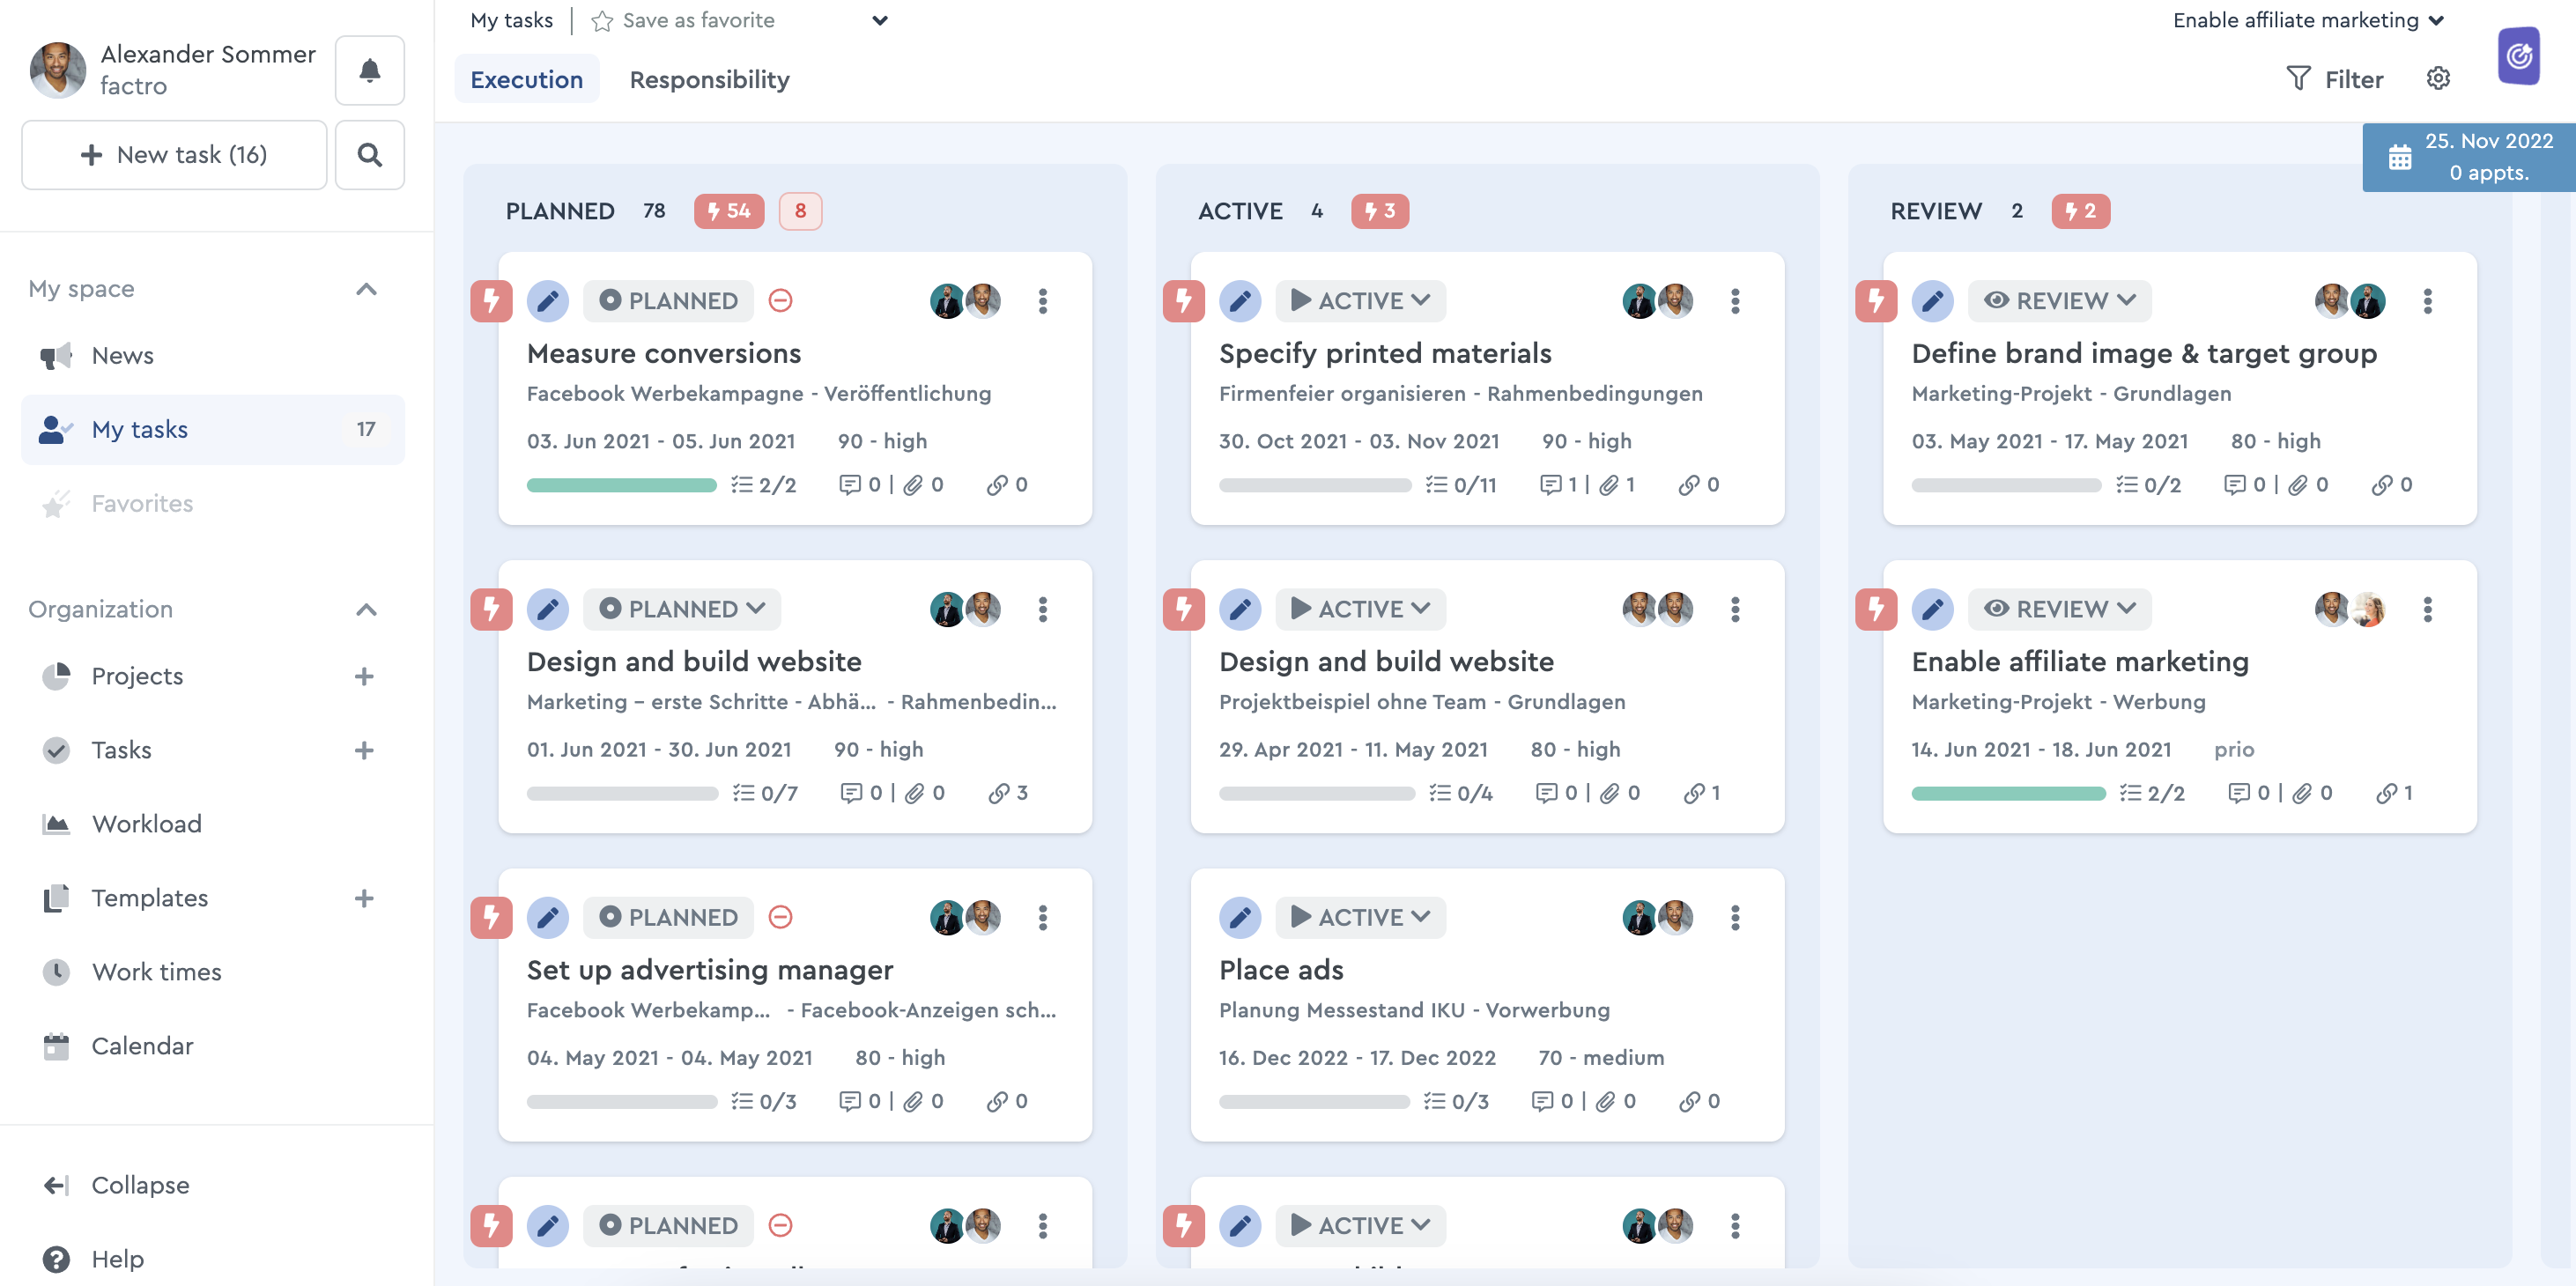
Kanban Board
The Kanban Board displays the project progress via the task status. You can see which tasks have which status, and therefore how far the project has progressed. The editing process of tasks starts with the status "planned", then continues with the status "active", followed by "review" and ends with the final status "done"
 The factro Kanban Board
Please note: Finished tasks appear for 24 hours in the "finished" column. After that you can find them in your task list in the view "All tasks" using the filter function.
Gantt Chart
Like the Kanban board, the factro Gantt Chart also helps to track the project progress using the task status along with the task colors. Finished tasks are recognized by the transparent bar color. Pending tasks have the color blue. Looking at the Gantt Chart you can see immediately, which tasks have already been finished (task = finished, task bar = transparent) and which tasks are still ongoing. The Gantt Chart is available from the Business Cloud.
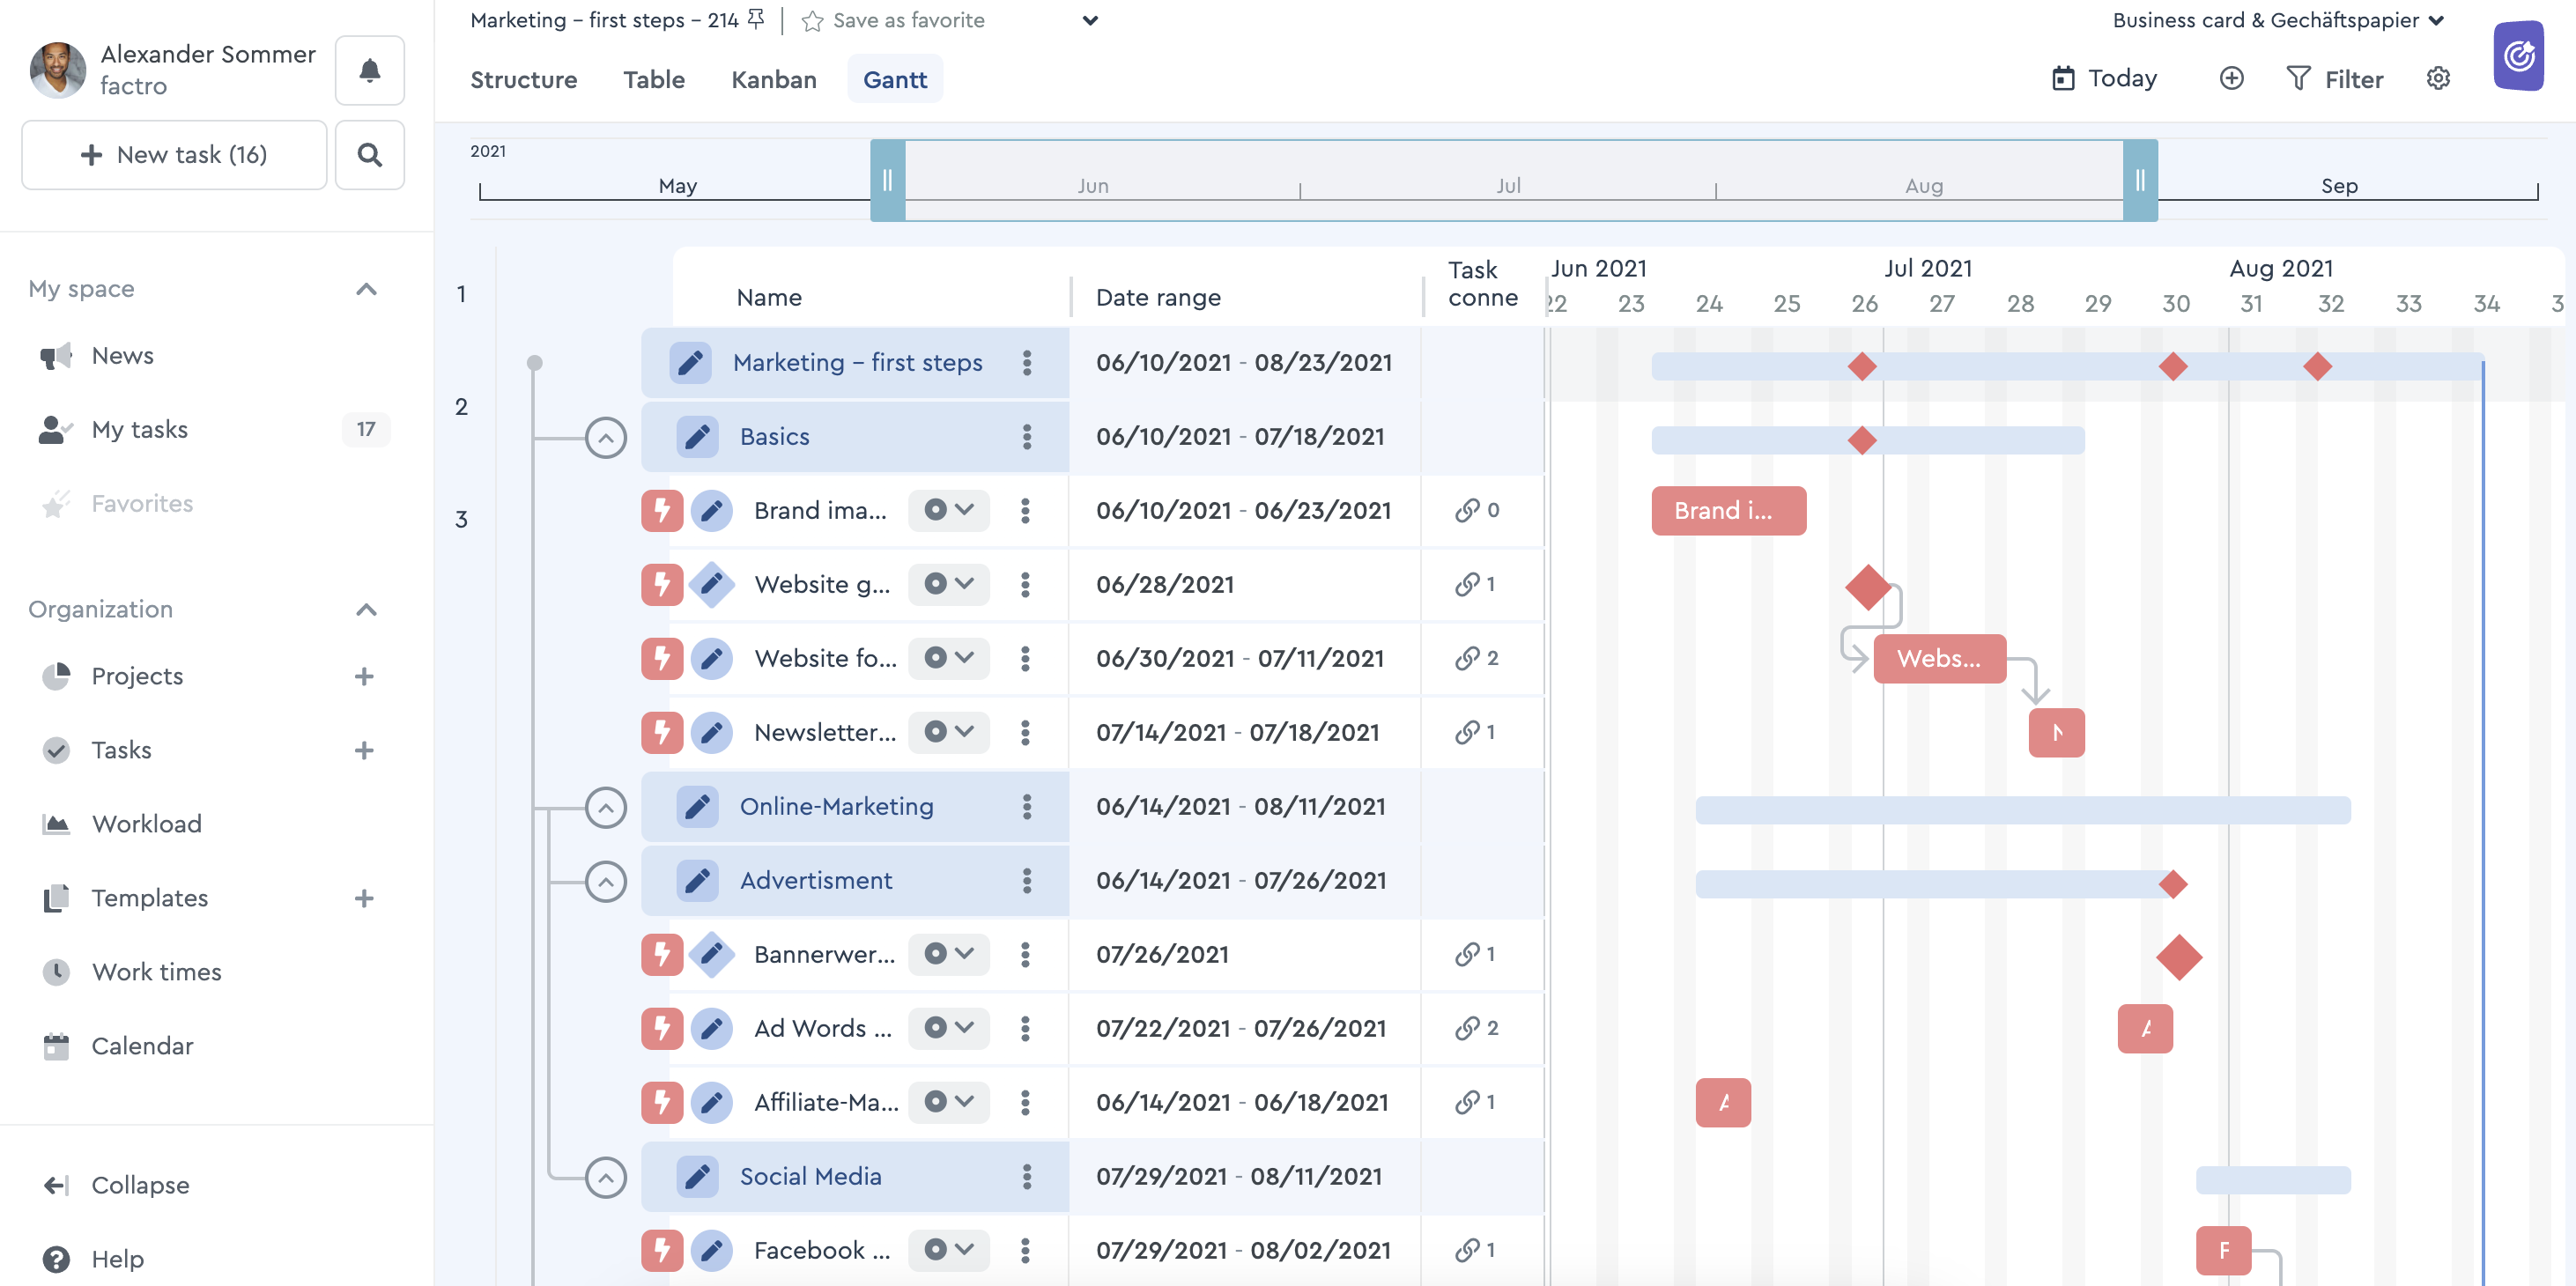 The factro Gantt Chart
Efforts
Starting with the Professional Cloud you can make use of planned, realized, remaining efforts in the project header to control your project progress and the workload over time. The activity recording offers you the following possibilities:
- Determine the target-performance comparison (planned/actual effort)
- View actually accrued efforts (actual effort)
- Stay on track and adjust efforts to reality (remaining effort)
- See actual time efforts in one view (forecast)
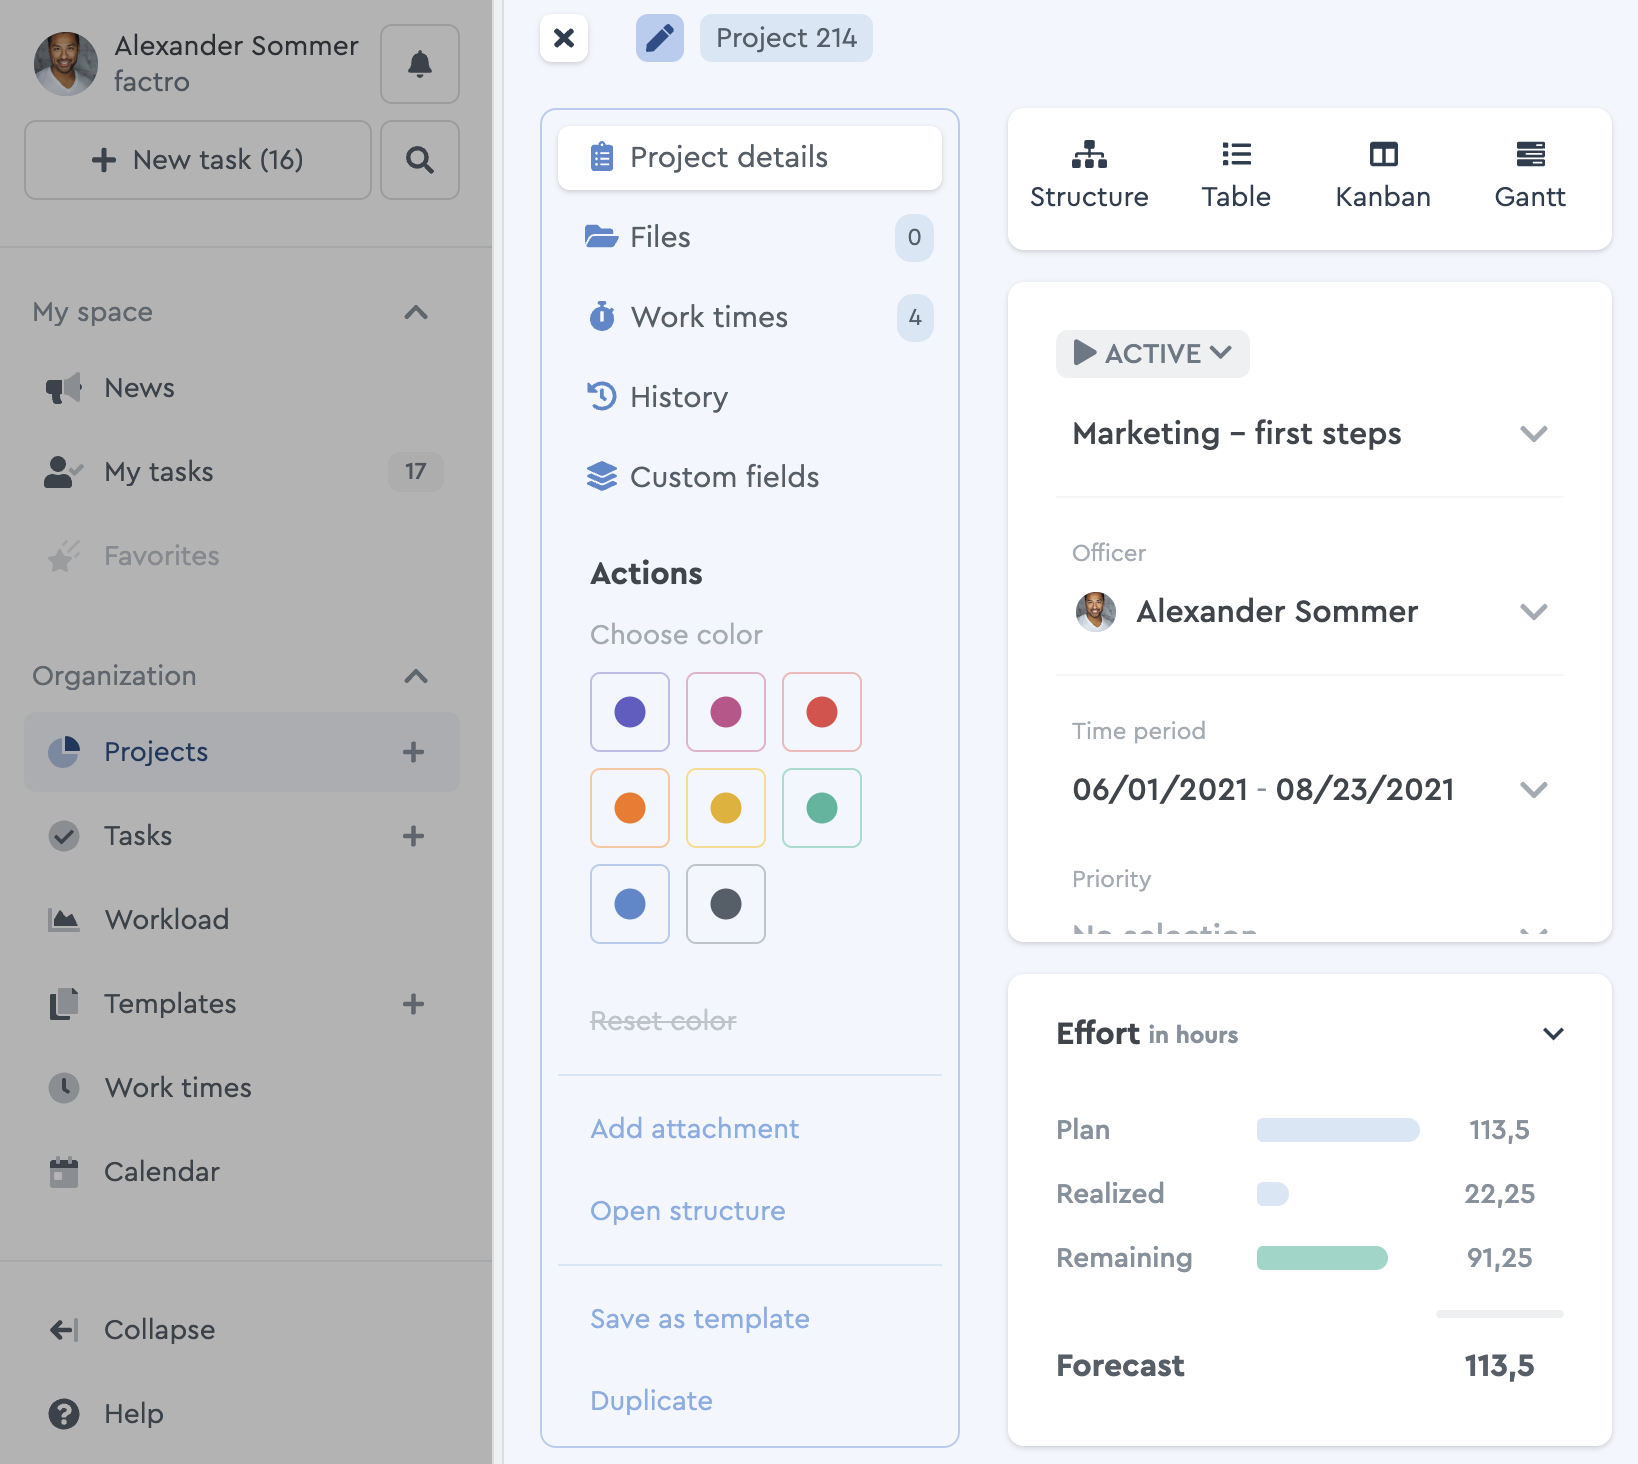 In the project in factro you can see the summarized efforts