What Are the Advantages of the Table View?
Project view: Table
The "Table" (starting from the Business Cloud) is one of the four project views in factro. All four views are synchronized with each other. If you create a new task in the Gantt Chart, you can work on it in the table, the work breakdown structure or in the Kanban Board.
That way, you are flexible during your daily project work and can choose a favorite view, depending on a preference for tables or visualized depiction. Do you prefer lists? Then you will like the table view.
In the project-oriented task list, you can quickly adjust several task details. Additionally, you can create different favorite overviews with the help of the filter and group function.
The table is automatically grouped by packages for a better overview. In the first line, next to the package name, you will find an overview of the summarized efforts, costs, etc. for the entire package. Sub-packages are also displayed in this way. This allows you to see important information at a first glance and the relationship to each other is recognizable.
Configure your table individually
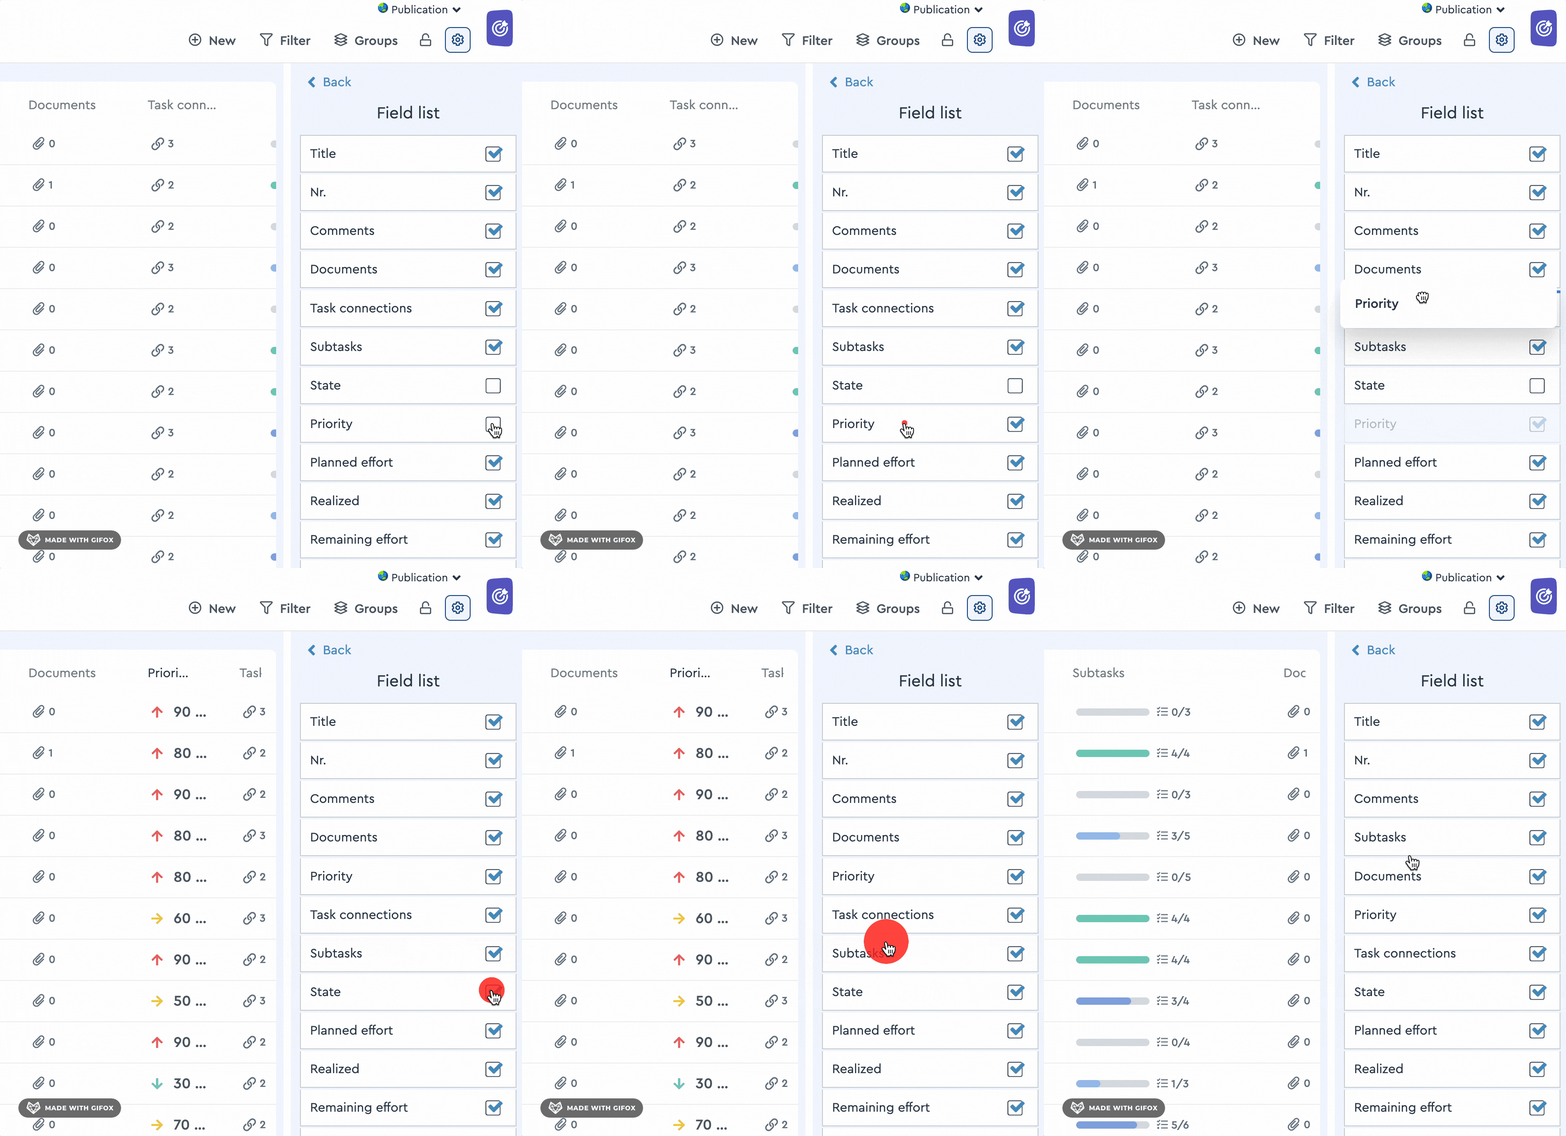
Using the field list, which you can find in the upper right corner via the settings wheel, you can arrange the columns according to your needs. Add or remove columns as needed and drag and drop the columns to the right place. This way you only have an overview of what you really need from the data set.
 You can add and arrange columns via the field list
Cross-project view
You can also work across projects with the table. You can filter, sort and organize all projects of your cloud via the table view. With the cross-project task list, starting from the Business Cloud, you can always keep track of all the to-dos in detail.

